Screenshots
See GXViewer in Action
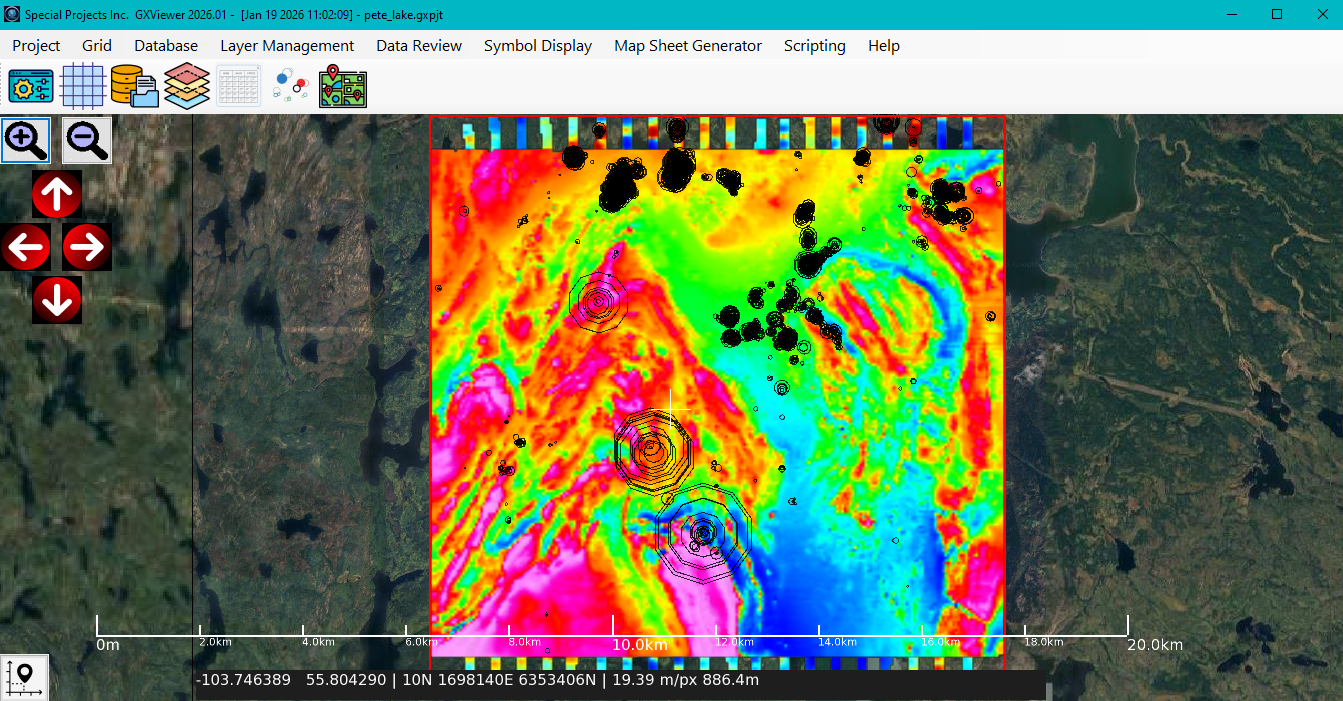
Main Window
The main interface showing grids and symbols displayed on an interactive map with layer controls.
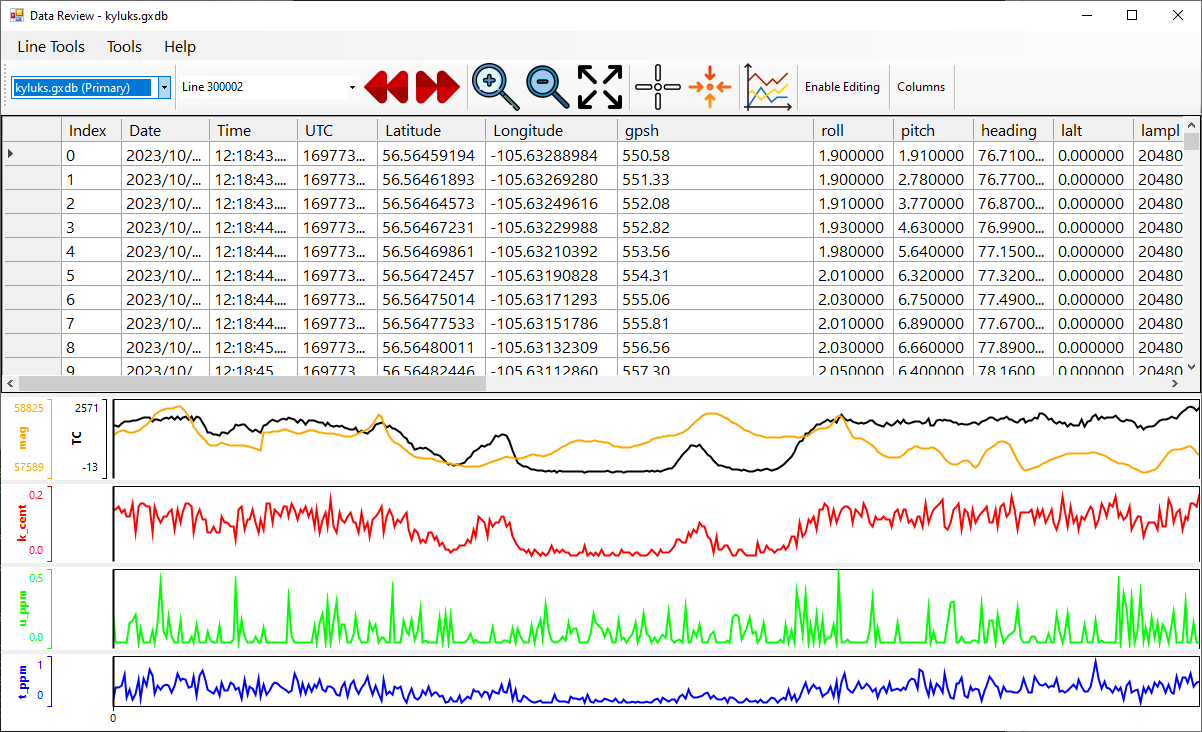
Data Review
View multiple data profiles simultaneously with synchronized cursors and tabular editing.
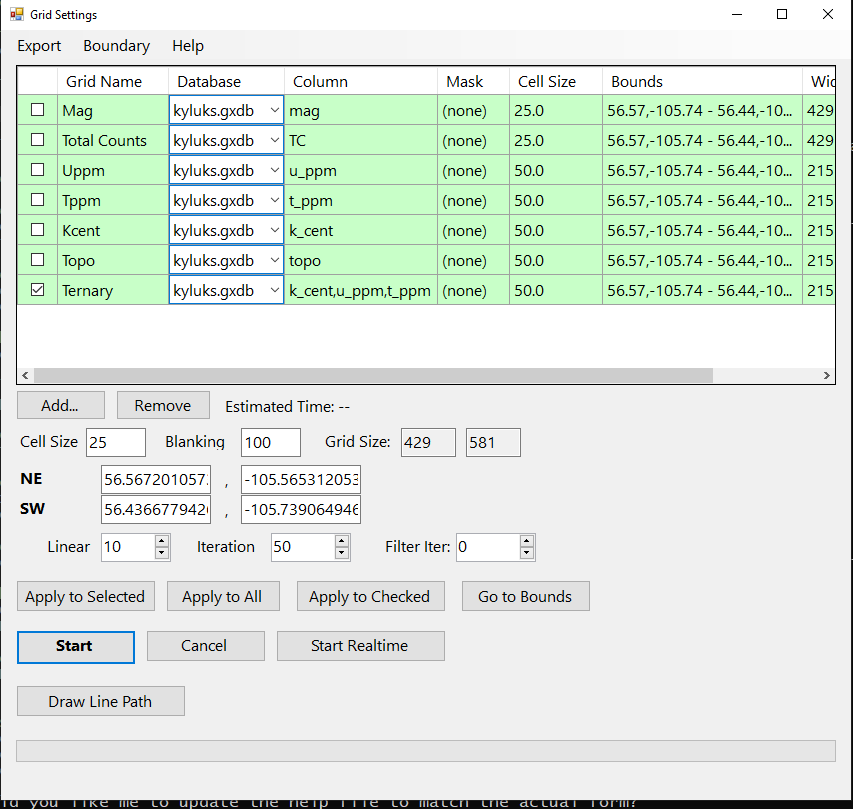
Grid Display
Create interpolated grids with customizable bounds, cell size, and visualization options.
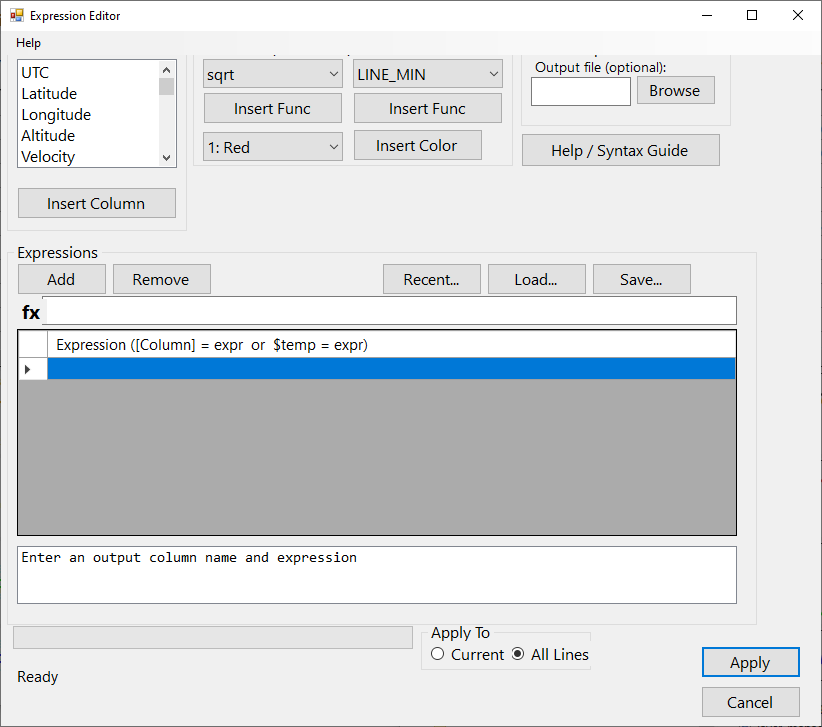
Expression Editor
Process data using mathematical expressions with built-in functions.
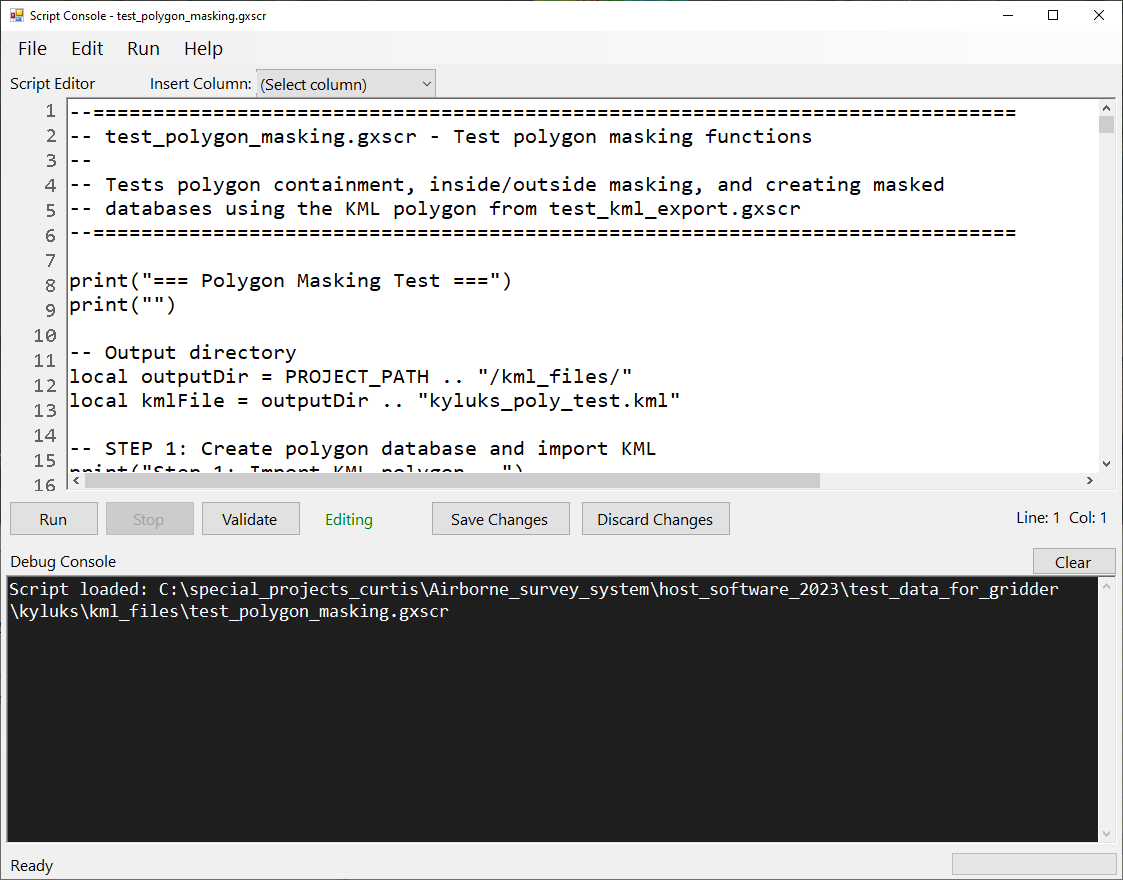
Script Console
AI-based scripting console for automation and batch processing.
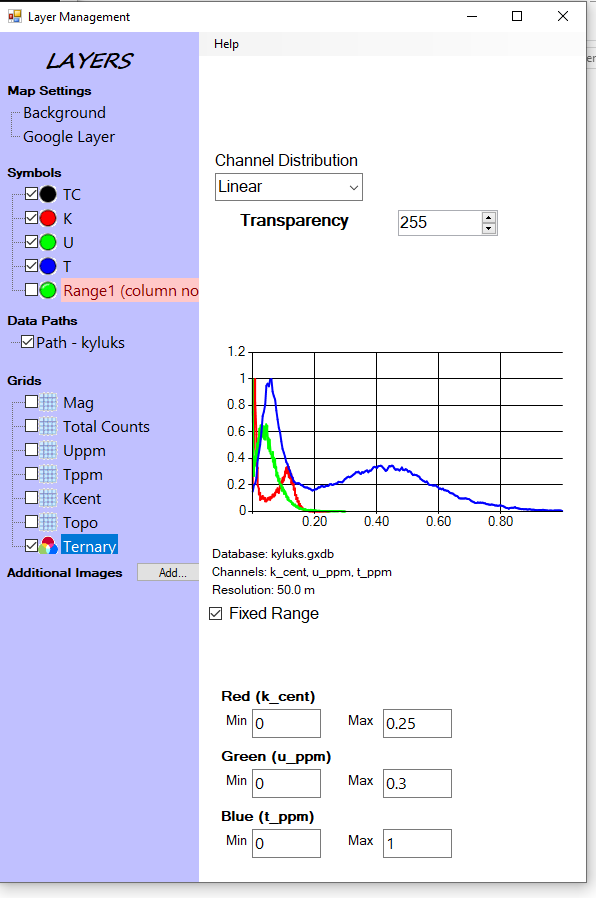
Layer Management - Grid
Configure grid layer settings with customizable and editable colormaps and display options.
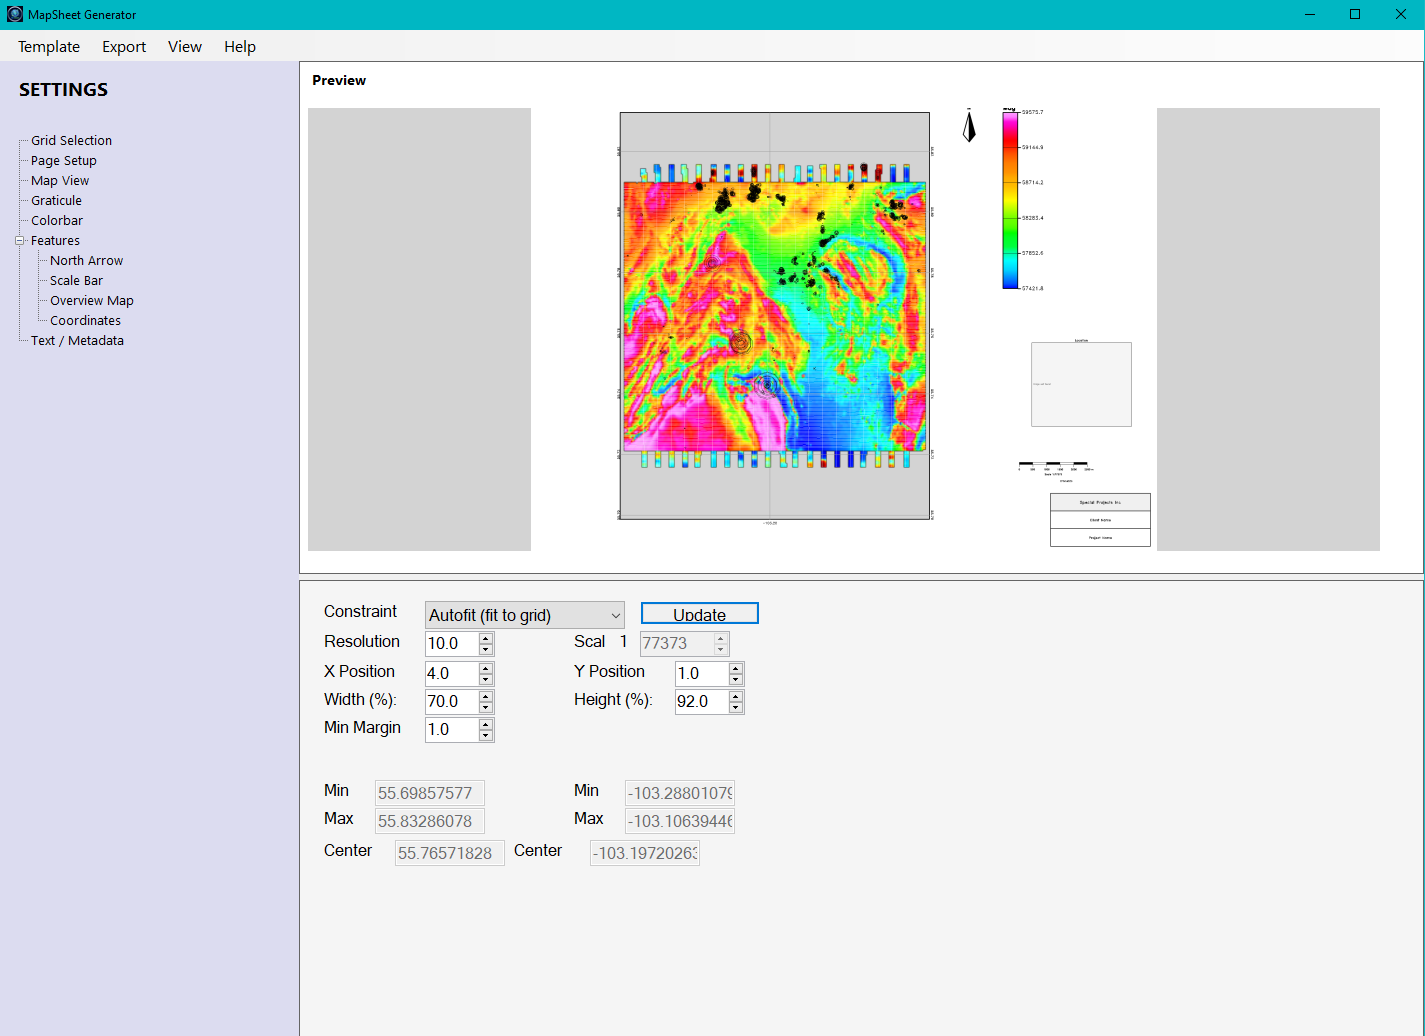
MapSheet Generator
Create publication-quality map outputs with customizable templates and layouts.